In the fast-moving digital landscape, data isn’t just a tool; it’s a competitive advantage. Web analytics helps businesses, marketers, and website owners transform raw traffic numbers into valuable insights that directly impact sales, customer satisfaction, and online visibility.
But for many, web analytics is underutilized, viewed as a numbers game, or something left to developers. The truth? Web analytics, when used strategically, is one of the most potent ways to improve website performance in measurable and meaningful ways.
We’ll break down exactly how to use web analytics to boost your website’s performance, from understanding key metrics and user behavior to running A/B tests and improving conversions.
What Is Web Analytics?
At its core, web analytics is the process of collecting, measuring, analyzing, and interpreting website data to understand how users interact with your online presence. This includes everything from how users find your site to what pages they view, where they click, how long they stay, and when they leave.
Some of the most widely used tools for web analytics include:
-
Google Analytics 4 (GA4) – for traffic, behavior, and conversions
-
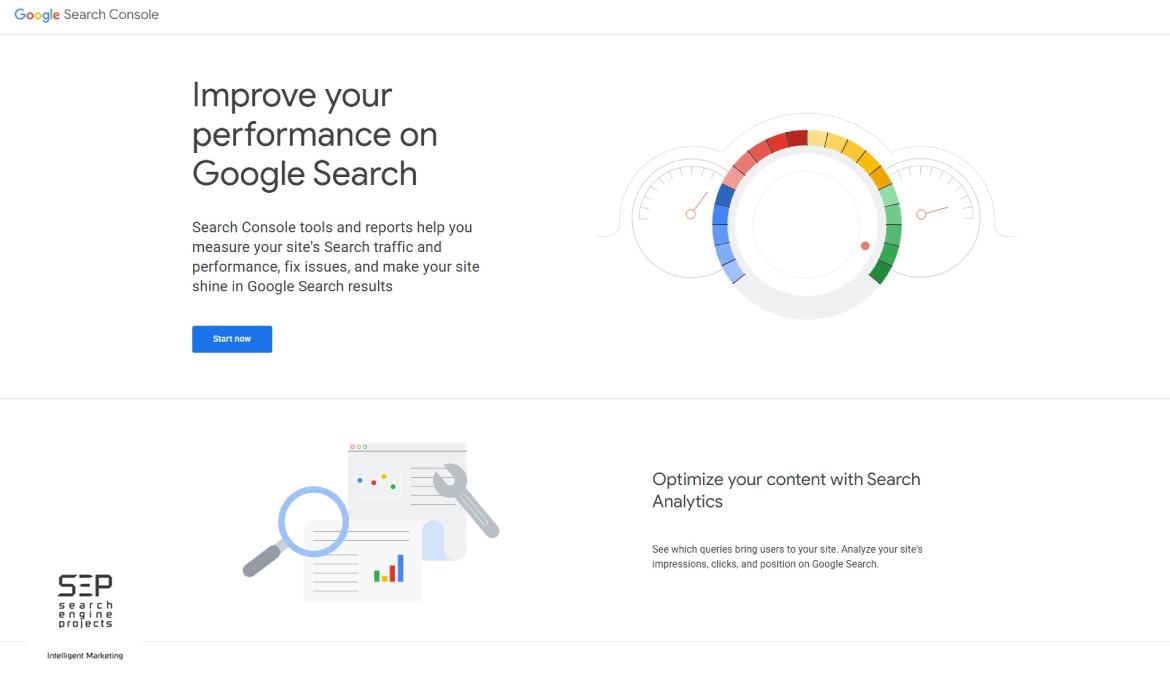
Google Search Console – for monitoring SEO and keyword performance
-
Hotjar / Microsoft Clarity – for visual behavior (heatmaps, scroll depth, session recordings)
-
Google Tag Manager – for managing tracking events and user interactions
-
Looker Studio (formerly Data Studio) – for custom reports and dashboards
 These tools help answer questions like:
-
Where are my users coming from?
-
What content do they engage with the most?
-
What’s causing users to leave my site?
-
How can I improve conversions?
Why Is Website Performance So Important?
Website performance affects everything: user experience, SEO, conversion rates, and ultimately your bottom line.
Here’s why it matters:
1. User Experience (UX)
Users expect fast, responsive, intuitive websites. If your pages take too long to load or your design is confusing, they’ll bounce—sometimes forever.
2. Search Engine Optimization (SEO)
Google considers site speed, mobile responsiveness, and UX signals (like bounce rate) in its ranking algorithm. Poor performance = lower rankings.
3. Conversions and Revenue
A one-second delay in page load can reduce conversions by up to 7%. Better performance leads to higher engagement, trust, and sales.
4. Retention and Loyalty
Returning users are gold. A well-performing site encourages repeat visits and builds brand loyalty over time.
Key Metrics to Track in Web Analytics
There are hundreds of metrics in most analytics platforms, but not all matter equally. Let’s break down the most impactful KPIs when it comes to improving website performance:

1. Bounce Rate
The percentage of visitors who leave after viewing only one page. A high bounce rate can indicate:
-
Irrelevant content
-
Poor user experience
-
Slow loading times
Fix: Improve content relevance, use better internal linking, enhance page design, and ensure fast loading.
2. Average Session Duration
How long do visitors stay on your site? Longer sessions generally mean better engagement.
Fix: Add multimedia, simplify navigation, and break long content into digestible sections to keep users interested.
3. Pages Per Session
It shows how deeply users explore your site. Low numbers suggest users aren’t engaging deeply with your content.
Fix: Improve internal linking, utilize related content blocks, and provide clear CTAs to guide users effectively.
4. Conversion Rate
Percentage of users who complete a desired action (e.g., buying, subscribing, or contacting).
Fix: Simplify forms, optimize checkout processes, use persuasive copy, and create a sense of urgency (limited-time offers, trust badges).
5. Exit Pages
The last pages users view before leaving. High exit rates on key pages can reveal pain points in your funnel.
Fix: Rework content, add calls to action, reduce form friction, or test alternative designs.
6. Traffic Sources
Understanding where your traffic comes from—organic search, paid ads, social, referral, direct—helps allocate resources effectively.
Fix: Strengthen top-performing channels and reevaluate low-performing ones (like updating ad targeting or SEO keywords).
How to Use Web Analytics to Improve Website Performance
Here’s a step-by-step strategy to use web analytics data to optimize and improve your site:
Step 1: Define Your Business Goals and KPIs
Before diving into analytics reports, clarify what success looks like. Goals can include:
-
Growing email subscribers
-
Increasing product sales
-
Boosting content engagement
-
Improving lead generation
Once you’ve set your goals, determine measurable Key Performance Indicators (KPIs). For example:
| Goal | KPI |
|---|---|
| Increase newsletter signups | Form submission rate |
| Reduce bounce rate | Bounce rate % per landing page |
| Improve mobile experience | Mobile session duration & bounce rate |
| Raise product purchases | E-commerce conversion rate |
Having clear KPIs helps focus your analysis and track real improvements.
Step 2: Implement the Right Tracking Tools
Install your analytics platforms correctly. This typically includes:
-
Google Analytics 4 (GA4): Install using Google Tag Manager or directly in your site’s code. Define conversions such as “button clicks”, “form submissions”, or “checkout completions.”
-
Google Search Console: Verify ownership of your website to gain SEO data like impressions, clicks, and indexing status.
-
Heatmapping Tools (Hotjar, Clarity): These help visualize where users click, scroll, or lose interest.
-
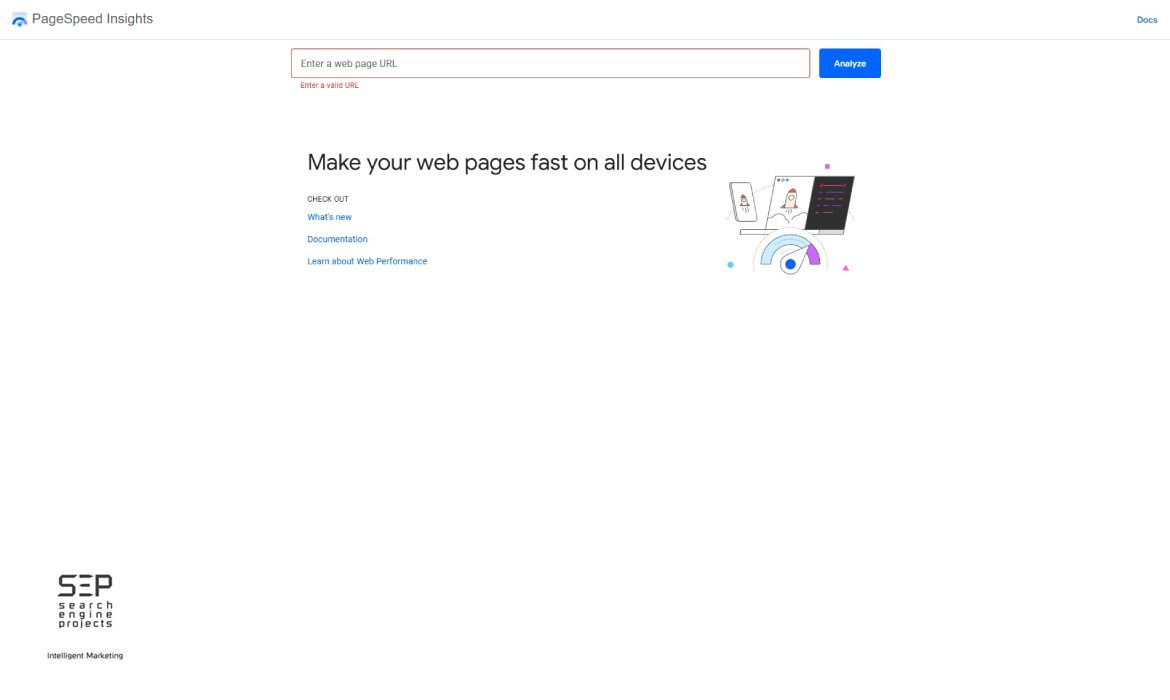
PageSpeed Insights: Essential for diagnosing slow load times and Core Web Vitals issues.
Without correct implementation, your data will be incomplete or inaccurate.
Step 3: Understand User Behavior
Use Behavior Flow reports or user session replays to answer questions like:
-
Which pages do users spend the most time on?
-
Where are they getting stuck?
-
Do they scroll down far enough to see CTAs?
This reveals design flaws, navigational barriers, or content that needs improvement.
Pro Tip: Watch session recordings to catch real user confusion in action, especially for forms and product pages.
Step 4: Improve Load Speed and Mobile Optimization
Nothing kills conversions like a slow site. Use PageSpeed Insights, Lighthouse, or GTmetrix to evaluate:
-
Page load time
-
Time to First Byte (TTFB)
-
Largest Contentful Paint (LCP)
Action Steps:
-
Compress images using tools like TinyPNG or WebP format
-
Use lazy loading for off-screen images
-
Minify CSS, JavaScript, and HTML
-
Implement caching and a fast CDN
-
Switch to speedier hosting if needed
Also, check mobile usability. In GA4, compare bounce rates, conversions, and session durations across mobile vs desktop.
Step 5: Analyze Traffic Sources and Campaign Performance
Use the Acquisition reports to see where your users are coming from:
-
Organic Search (SEO)
-
Paid Search (PPC)
-
Direct (typed URL)
-
Referral (backlinks)
-
Social (Facebook, Instagram)
-
Email
This helps determine:
-
Which marketing channels are most effective
-
Where to increase budget or cut losses
-
Whether your SEO strategy is driving results
Example: If Facebook traffic has high bounce and low time on site, maybe your ad creative is misleading, or your landing page isn’t aligned.
Step 6: Monitor Conversion Funnels
A conversion funnel tracks the steps users take to complete a goal (like purchasing a product). Typical funnel:
-
Product Page → Add to Cart → Checkout → Payment → Confirmation
Use GA4’s funnel analysis or eCommerce tracking to see where drop-offs happen. If most users abandon at the checkout page, consider:
-
Reducing form fields
-
Adding trust signals (e.g., SSL badge, testimonials)
-
Offering guest checkout
Bonus Tip: Run cart abandonment email campaigns and retargeting ads.
Step 7: Conduct A/B Tests
Use A/B testing tools like Google Optimize (discontinued as of September 30, 2023) or VWO to test:
-
Different headline variations
-
Call-to-action button colors or placements
-
Form layouts
-
Product descriptions
Measure which version gets more conversions or engagement. Then, roll out the winner site-wide.
A/B testing backed by analytics ensures that design changes are data-driven, not opinion-driven.
Step 8: Segment Your Audience for Deeper Insight
Not all users behave the same. Segment by:
-
New vs. returning visitors
-
Mobile vs. desktop users
-
Location or language
-
Source or campaign
Example: You might find that returning users convert at 2x the rate of new ones, suggesting you should focus on email nurturing and retargeting.
You can also create audiences for remarketing in Google Ads, using behaviors like:
-
Visited the checkout page but didn’t convert
-
Read a specific blog post
-
Stayed longer than 3 minutes
Step 9: Track and Optimize On-Site Search
If your site includes a search bar, track what users are searching for internally. This data can show:
-
What users want but can’t find
-
New product ideas
-
Confusing navigation structure
Set up site search tracking in GA4 by identifying the search query parameter (like ?q= or ?s=). Use that data to:
-
Create new content or landing pages
-
Reorganize menus
-
Improve naming conventions
Common Pitfalls to Avoid in Web Analytics
Even with all the right tools and intentions, these mistakes can hurt your progress:
Tracking Too Much
Avoid information overload. Focus on a small number of KPIs that tie directly to your business goals.
Misinterpreting Correlation as Causation
Example: A spike in conversions doesn’t mean your last blog post caused it—check your acquisition channels and campaigns for the real reason.
Ignoring Mobile and Accessibility
If analytics indicate high mobile bounce rates, your mobile site may be malfunctioning. Regularly test across devices and improve accessibility.
Not Acting on Insights
The biggest sin in web analytics is failing to apply what you learn. Every report review should result in one to three actionable changes.
Final Thoughts: Turn Data into Action
Web analytics can tell you what’s working, what’s not, and what to fix—but it won’t do the work for you. The real magic happens when you apply what you’ve learned:
-
Streamline your site based on bounce and exit rates
-
Improve speed and mobile responsiveness
-
Refine your funnel using conversion data
-
Experiment and iterate using A/B tests
-
Reinvest in channels that drive meaningful traffic
The cycle of analyze → test → optimize → repeat is the engine of high-performing websites. Whether you’re a solo founder, a marketing team, or an e-commerce store, mastering web analytics is essential for long-term growth.

Need Help with Web Analytics?
If you’re unsure how to implement tracking, interpret reports, or develop data-driven strategies, consider partnering with an experienced digital marketing team. They can audit your analytics setup, define the right KPIs, and help you turn raw data into business results.
Conclusion: Turn Data into Action with Expert Support
Web analytics is more than just charts and dashboards—it’s the key to transforming your website into a high-performance marketing and sales engine. When you understand where your users come from, what they do on your site, and what stops them from converting, you can make precise improvements that lead to measurable growth.
From improving page speed and mobile responsiveness to refining your conversion funnels and optimizing content strategy, data-driven decisions powered by web analytics will consistently outperform guesswork.
However, many businesses struggle with setup, interpretation, or simply finding the time to dig into reports. That’s where the right partner makes all the difference.
Work with Search Engine Projects for Professional Website Analytics
At Search Engine Projects, we specialize in helping businesses harness the full power of web analytics to improve website performance and generate real ROI. Whether you’re starting from scratch or want to fine-tune an existing strategy, our team provides:
-
Google Analytics 4 setup and optimization
-
Custom KPI tracking and dashboard creation
-
Heatmap and user behavior analysis
-
Conversion rate optimization (CRO)
-
Ongoing performance reporting and strategy updates
Don’t leave your website’s success to chance. Let the experts at Search Engine Projects turn your data into tangible results.
Contact us today to schedule a complimentary consultation and discover how we can enhance your website’s performance with the power of web analytics.


